

| Sound | A pressure variation in air that creates an auditory effect. |
|---|---|
| Noise | Unwanted sound, sound without particular value. |
| Decibel (dB) | Unit of sound or noise measurement versus frequency. |
| Sound Transmission Class (STC) | Rating system used to measure the transmission loss (decibel reduction) of various materials. Testing method is ASTM E 90 that compares the transmission loss for the material at the 500Hz range. |
| Transmission Loss (TL) | The reduction of sound passing through materials when tested in accordance to ASTM E 90. |
| Noise Reduction (NR) | This is the actual difference in sound between two areas. The NR is determined by the transmission loss of the material between the two areas. |
| Noise Reduction Coefficient (NRC) | Rating system that measures the ability of materials to absorb sound. |
Resources

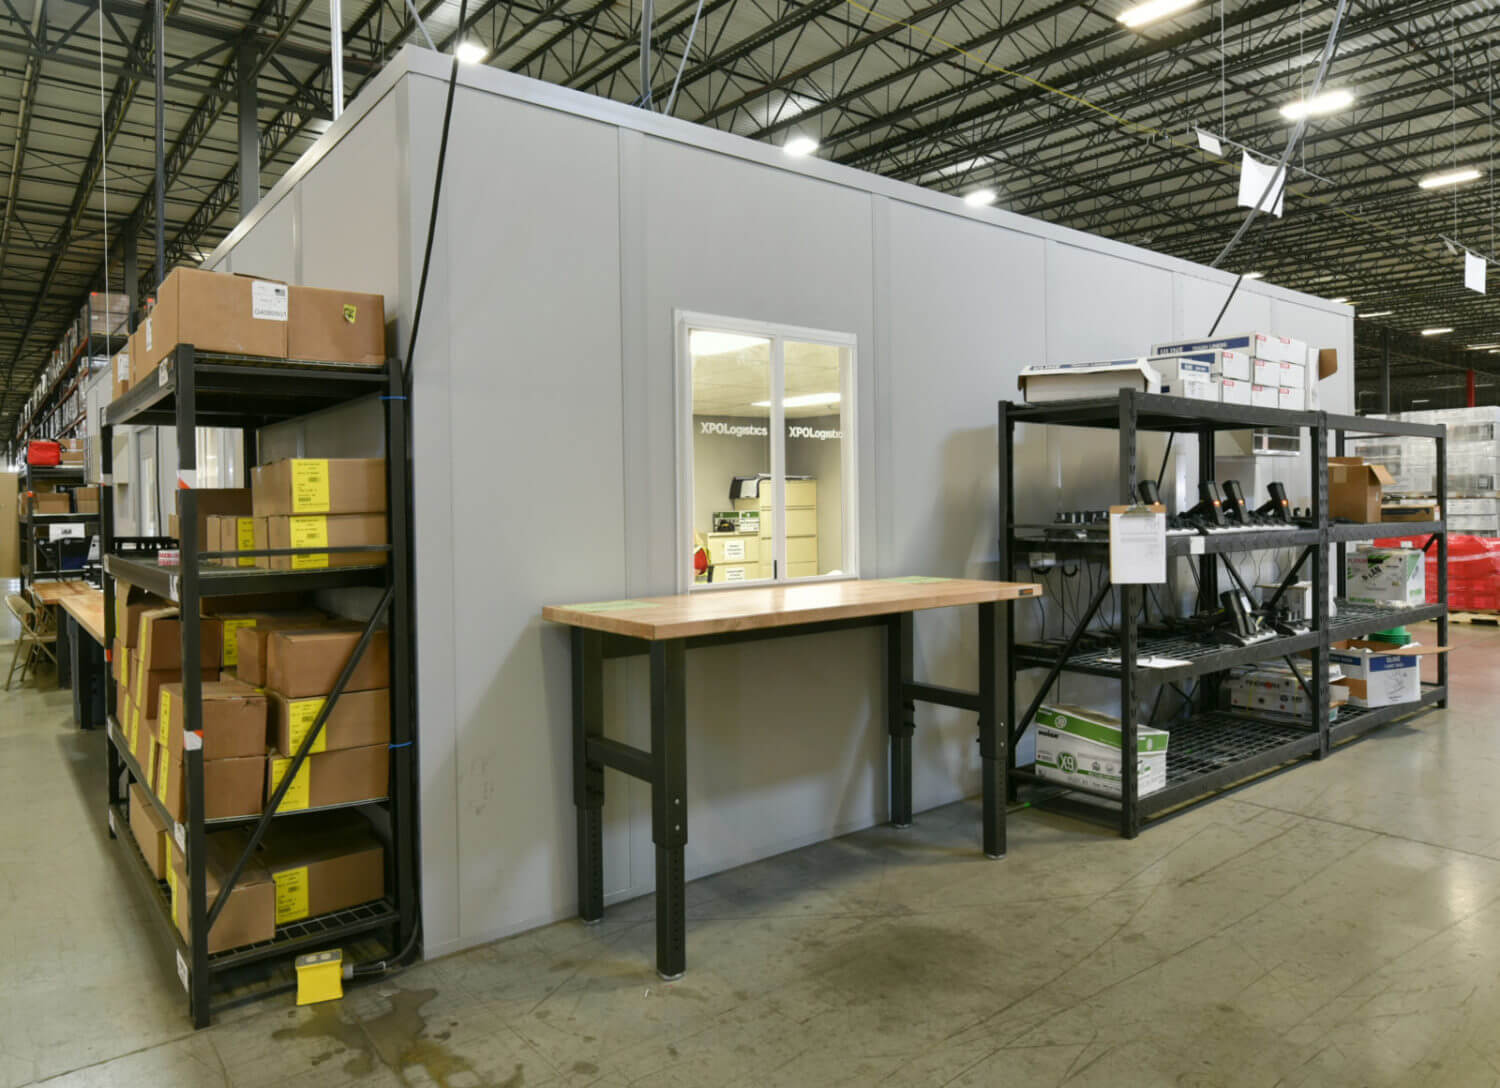
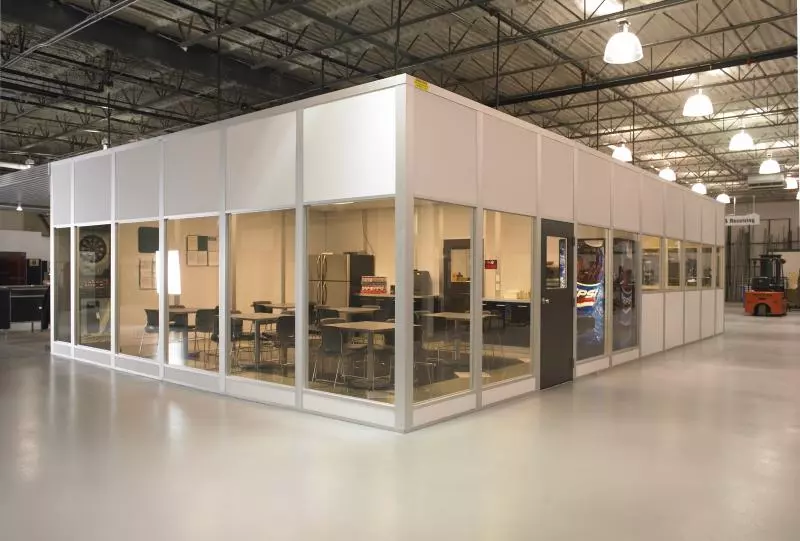
Starrco prefabricated offices can be extremely effective in dealing with noise problems within a working environment. Listed below are some items to consider when designing for noise control:
Starrco offers modular wall panels with three different constructions. The STC ratings for each available panel construction are shown below. Also shown are the STC ratings for some of the common components of our Prefabricated offices:
| Panel Types | SP | SC | DL |
|---|---|---|---|
| SS3000 3″ Thick Panels | 22 | 33 | 28* |
| SS3500 3″ Thick Panels | 22 | 33 | 28* |
| 3070 Pre-Finished Wood Door | – | 26 | 26 |
| 3070 20 gauge Steel Door | – | 30 | – |
| Window w/1I4″ Tempered Safety Glass | – | 28 | – |
| Window w/1I4″ Laminated Safety Glass | – | 34 | – |
| 2′ x 4′ Mineral Fiber Ceiling Tile | – | 35-39 | – |
Please keep in mind the STC ratings are a result of laboratory testing. The actual sound reduction experienced in the field will be less. The amount of reduction achieved depends upon the type and frequency level of the noise source and the quality of the installation.
*Remember, the STC rating represents the decibel reduction at a single frequency level. The 3″ thick panels have superior sound control capabilities at the higher frequency levels.
The chart shown below shows the correlation between some common noise sources and decibel levels. This can help to give some perspective to how loud a particular decibel level may be:
| Decibel Level | Sound Source |
|---|---|
| 170 | Jet Engine |
| 150 | Prop. Engine |
| 140 | Pain Threshold |
| 130 | Jack Hammer |
| 110 | Punch Press |
| 90 | Busy City Street |
| 70 | Business Office |
| 60 | Normal Speech |
| 50 | Business Office (Private) |
| 40 | Library Room |
| 20 | Quiet Speech (Whisper) |
| 0 | Hearing Threshold |
As previously mentioned OSHA limits the amount of time workers may be exposed to noise levels of 90 dB or greater. Pre-Engineered “break-rooms” located on the production floor can help meet exposure requirements while maximizing the available productive time of workers In an area.
| Allowable Work Hours | Decibel Level |
|---|---|
| 8 | 90 |
| 6 | 92 |
| 4 | 95 |
| 3 | 97 |
| 2 | 100 |
| 1.5 | 102 |
| 1 | 105 |
| 0.5 | 110 |
| 0.25 | 115 |